|
Title |
Las zonas climáticas |
|
Unit/Activity No. |
Natural Disasters/Activity 2 |
|
Geographic Topic |
climographs, climactic zones |
|
Language Topic |
weather, places, academic content |
|
Language Function |
describe location, weather |
|
Language Standard |
1.2, 1.3, 3.1 |
|
Geography Standard |
1, 4, 5, 7, 8 |
| Step 1. | Before class prepare a handout and a transparency. Make one copy of Handout 3 and cut apart the cities/countries. |
| Step 2. | Place Transparency 1 of the climogramas for Quito and Guayaquil on the overhead. Using the script below, explain to the students what the specific features of the climogramas are by pointing them out on the transparency. Have the students compare and contrast the climogramas of each city. |
| Step 2. | Distribute Handout 1 and Handout 2. Use Transparency 2 to indicate the different climate zones around the world based on temperature and precipitation (see Vocabulario útil). |
| Step 3. | Have each student draw from a hat or bag the name of a city and country. Students are to use an atlas, almanac or internet source to find the monthly temperature and precipitation averages of the city as well as the longitude, latitude and altitude of that city. Based on that information, they are to categorize the city into a climate zone. Model one example carefully and check to see that they understand the process. |
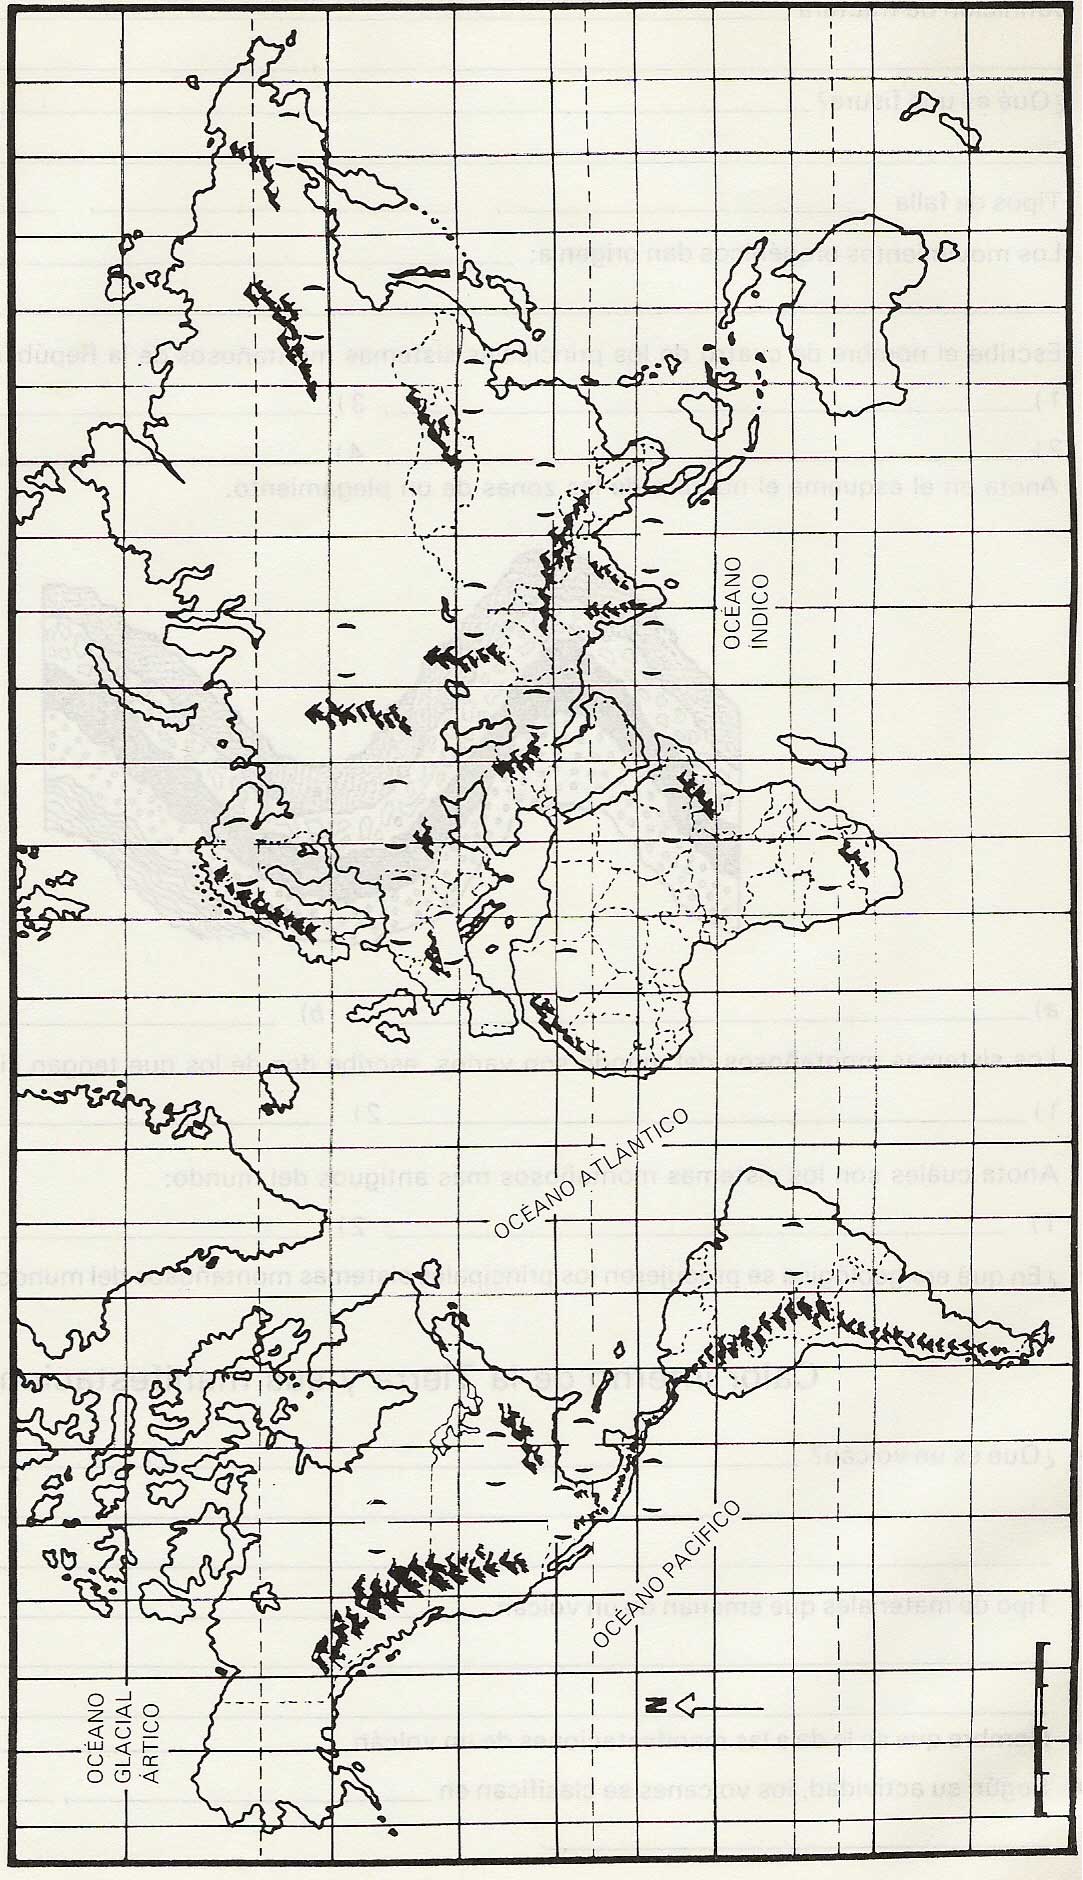
| Step 4. | Have students start in pairs and share their cities. With the map, they are to plot the cities on the map according to longitude and latitude, and then they are to fill in the accompanying worksheet with the zona climática of the city. |
| Step 5. | Have students regroup so that each works with a different partner. During this second round, each partner describes the cities he/she has already plotted. Continue reforming groups until all the cities are plotted. Students will not have to visit with everyone in the class to get all the cities since each group change puts them into contact with an increasing number of cities. |
| Step 6. | Based on the information they have received about the cities, have the students indicate some sort of boundaries on the map for the climatic zones. Hint: have them find cities with similar characteristics and group them together. |
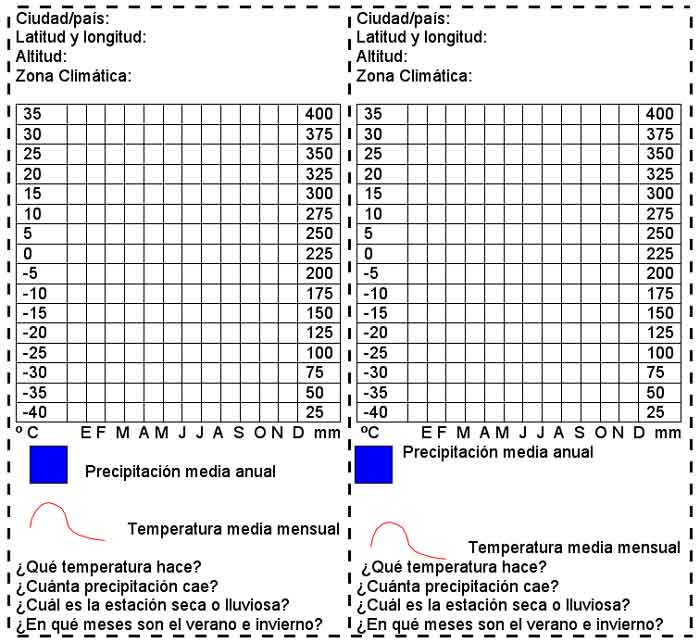
Los climogramas son las gráficas que recogen las variaciones anuales de las temperaturas y las precipitaciones de una localidad geográfica para comparar los diversos climas. Para elaborar un climograma, se indican en una gráfica la precipitación media mensual en milímetros (mm) y la temperatura media mensual en grados Celsius. Las variaciones de las temperaturas están representadas por una línea mientras que las precipitaciones están representadas por barras. Con esta información pueden determinar las zonas climáticas.
Use the abbreviations on the chart to review the months of the year and the numbers needed to read the climograma.
Leave Transparency 2 on the overhead projector while the students are working.
Have students make a climograph of the world by combining the information graphed in their research in this activity. Use a large world map that can be displayed on the wall of the classroom.
· Zona extremadamente árida
· Zona árida
· Zona tropical
· Verano largo, invierno moderado
· Verano largo, invierno frío
· Zona templada
· Verano fresco, invierno moderado
· Verano fresco, invierno frío
· Verano muy fresco, invierno moderado
· Verano muy fresco, invierno frío
· Invierno perpetuo
Atlas, almanac, and/or computer with internet access to find climatic and geographic information.
Recommended internet site: http://www.worldclimate.com
Handout 1
Busca la latitud y longitud, altitud, precipitación mensual y temperatura mensual de la ciduad que escoges del sombrero. Después, en la gráfica, crea un climograma de esta ciudad según la clave. Será necesario pasar de la escala Fahrenheit a la escala Celsius. Nota que la precipitación se expresa en milímetros.
Handout 2
Handout 3
Transparency 1

Transparency 2
Zonas Climáticas
· Zona extremadamente árida
· Zona árida
· Zona tropical
· Verano largo, invierno moderado
· Verano largo, invierno frío
· Zona templada
· Verano fresco, invierno moderado
· Verano fresco, invierno frío
· Verano muy fresco, invierno moderado
· Invierno muy fresco, invierno frío
· Invierno perpetuo